


POWER BI DATAFLOW
- Rohit Kumar

- Jun 27, 2023
- 5 min read
Power BI is widely used visualization tools in variety of industries today. Its capability to present data in some fantastic charts and visuals stands it out. Data in it can be imported from tons of source systems, whether it is in database in file or from SharePoint in no time. We can also manipulate the data after being loaded in the Power BI Desktop file but what if we want to use a table manipulated in Power Query, for a new report. In general we will have to manipulate that data separately for each report and it will be a tedious task to perform in repetitions.
Dataflow is the solution here. It is a collection of tables that are created in the Power BI service workspaces. With Dataflow, we can achieve data translation functionality in Power BI Service, it means all the operations that are available in Power BI desktop, can be performed in Power BI Service. We can run all Power Query operations from the cloud independently.
In general, we load our data in Power BI desktop, build some visualization and then we publish the report to Power Bi Service. When we publish any report to Power BI Service, we can see the report and a dataset with the same name as of a report. The dataset is the file which is associated with the Power BI report. Dataflow is totally independent of the dataset of any report and the refresh is also performed independently in the cloud.
In Power BI dataset we are storing the data In-Memory. Dataflow uses the process of Azure Data Lake Storage.

Image reference: https://docs.microsoft.com/en-us/power-bi/transform-model/dataflows/dataflows-introduction-self-service
When to use Dataflow:
1. To avoid maintenance-cost
As we have discussed earlier that if we want the same table in multiple reports, we must get the report from the source every time and if we perform any data transformation operation in the table and use it in any report and want that same operations on a table in other report then we have to do it again and again. Isn’t it too head-scratching? Yes! It is.
Dataflow is something that provides us the centralized location to our workspace. Suppose, we create a dataflow with our desired tables and perform all the ETL operations in Power BI Service itself and then we call that Dataflow in our Power BI Desktop from our Workspace. So, every time there is some data update required in table that is used in multiple reports, we need to change only the Dataflow. So, the maintenance-work becomes easy.
2. Independent Table Refresh:
Dataflow is independent from the report refresh. We can refresh specific tables with Dataflow. With Dataflow, we can refresh more transactional tables on hourly basis (or whatever is needed) and other tables on daily/weekly/monthly basis. So, it gives us that freedom from report refresh.
How to Create a Dataflow:
To create a dataflow we have to follow the steps mentioned below:
Step1: Open the Power BI Service.
Setp2: Go to the “Workspace” pane on the left-hand side of the screen and click it.
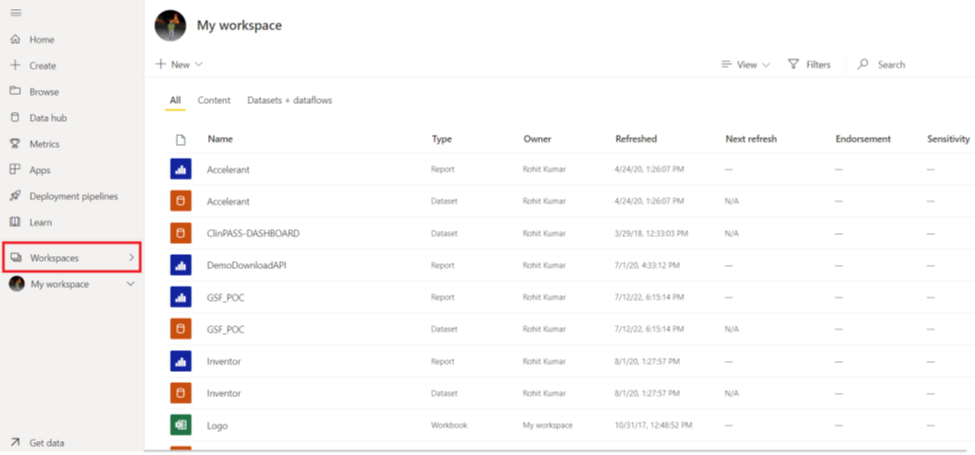
Step3: After that click on “Create a workspace”.

Step4: Give a suitable name the workspace and hit on ‘Save’. It will create a new Workspace in the Power BI Service.

Step5: On the upper-left side of the Workspace window, click on the (+) New Icon. Select Dataflow from the list. It will open a new window as in the screenshot.

Step6: There is option named ‘Define New Tables’. We can create a fresh Dataflow with the help of this option. To do that, Click on Add new Tables option in Define new tables. We get a list of options after clicking ‘Define new tables’ as we have Get Data in Power BI desktop.

Step7: We can select data source as per our need. Let say, we select SQL Server Database as a source. After clicking it we get a new window with Connection Settings and Connection credentials. If we have on-premises SQL Server database then we need to install Data Gateway from the Power BI Service.

Step8: After filling the credentials we can choose the desired tables from the database and click on Transform data.


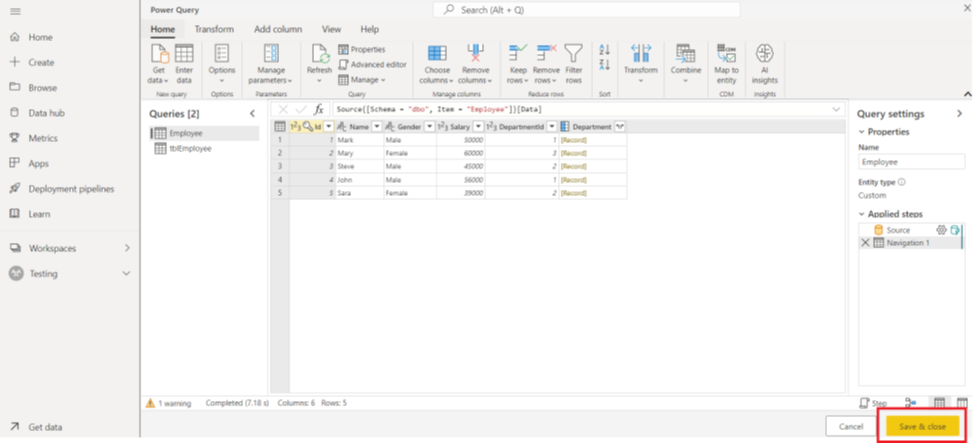
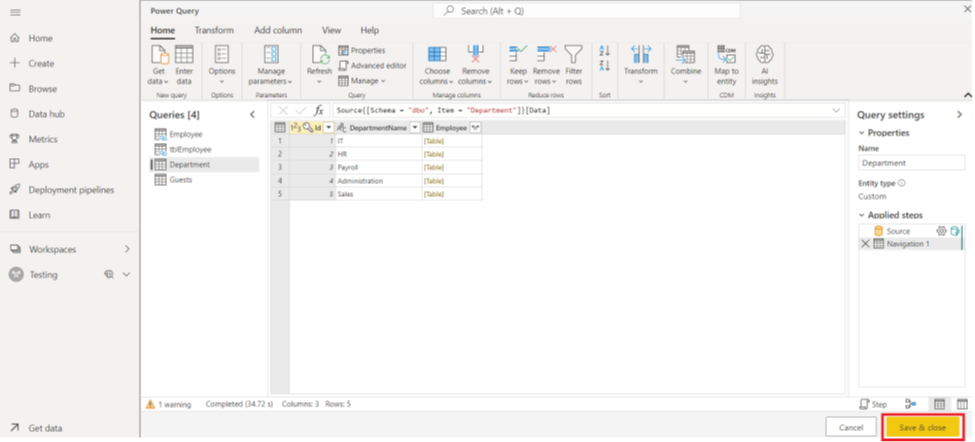
Now we get a window similar to Power Query. Every operation that we are doing in this window is like the operation we do in Power BI desktop. We can perform all the ETL operations here. After all the operations, click on “Save and Close”.
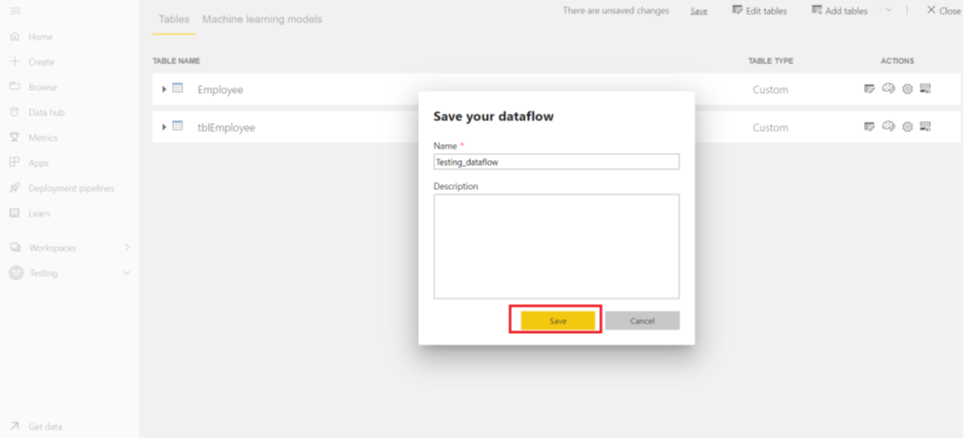
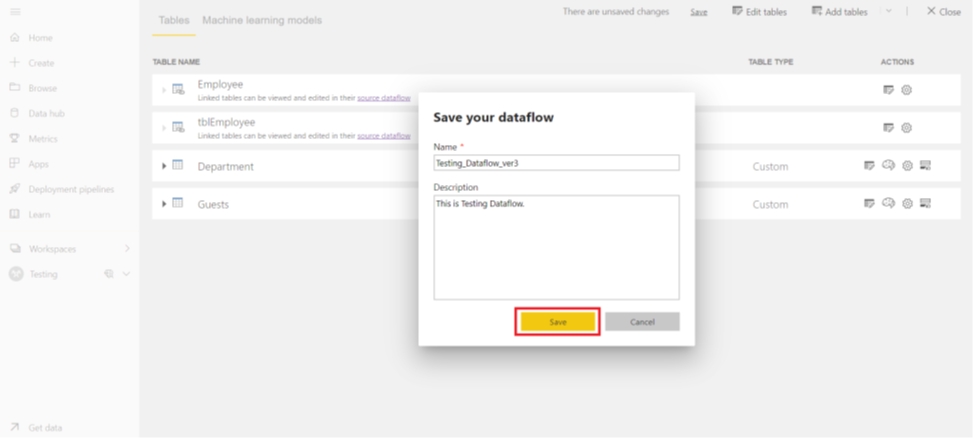
Step9: We need to provide suitable name of the Dataflow and click on “Save”.
This will create our Dataflow.
Note: Once the Dataflow is created, we need to refresh our data. If we forget to refresh the data and we use that Dataflow in some other Dataflow, then it will not show any data.

Link entities from other dataflows:
This option is useful in scenarios where we need to use the tables of an existing dataflow. We don’t need to add tables again and again. To reduce the duplication, we choose the option “Link tables from other dataflows” which leads us to use tables existed in an existing dataflow with other desired tables.
To work with “Link tables from other dataflows”, we need to follow steps mentioned below:
To do that click on Workspace, then click on (+) New and choose Dataflow. Then from the options now click on “Link tables from other dataflows”.

A window with Connection credentials will open. After filling all the fields, we will click on “Sign-in” and after that click on Next.


By clicking Next a window with our workspaces having dataflows is shown. After selecting your desired tables from the dataflow, click on “Transform data”.

To load other tables, click on “Get data” and click on the desired data source, i.e. Excel workbook, SQL Server database, Text CSV etc. Let’s get the table from SQL Server database.


When we click on SQL Server Database, we get a credential window.

After filling the credentials, we can access all the tables of that database. Click on the desired table/tables.

After selecting the desired tables, we can also perform ETL operations. After transforming the data, click on “Save and close”.
We get a window after that in which we must give a suitable name for our dataflow. Save that name and refresh the dataflow.
If we open the dataflow, it will show us the linked dataflow and the added tables in a list.
Use a dataflow in Power BI Reports:
To get the data from the dataflow, open Power BI desktop and click on “Get Data”. It will open a list of data sources. Click on the desired data source. In this case desired data source is Dataflow which has physical data stored in Azure and is managed by Power BI.

A sign-in window will appear. Login with Azure Active Directory email used in the Power BI service while creating Power BIdataflow.
The screen will now show the available dataflows. The below listed dataflows can be accessed by any other user who is a Member at the Workspace with permissions to access it.
Expand the dataflow and choose the tables that are required to make the visuals.

Now the tables are available. We can create any type of visuals that the required for the report.

Conclusion:
Dataflow is used for data transformation in Power BI and it is independent of any other Power BI objects. We can achieve all the results using Power Query engine and the Power Query Editor online. Dataflows can be used to unify data from multiple data sources and can enable Power Query Designer embedded in any platform where execution process is in Power BI Service. The advantage of Dataflow is that we can re-use our existing tables in multiple files where we can do additional data mashups. It increases the usability of the table in different reports and reduces the overhead of repetitive tasks. Dataflow acts like a reusable data entity backed by Azure in Power BI Service.


Comments